1990 E. Grand Avenue
1990 E. Grand Avenue
The following companies are included in our compensation benchmark groups used for our 20152017 Compensation Decisions (all data from Equilar as of January 2015)April 2017).
OPOWER, INC. /DEL/ |
PDF SOLUTIONSDST SYSTEMS INC |
QADDUN & BRADSTREET CORP/NW |
| ENCORE WIRE CORP |
| Endurance International Group Holdings, Inc. |
| ENGHOUSE SYSTEMS LTD. |
| EPLUS INC |
SILICON IMAGEESCO TECHNOLOGIES INC |
SILVER SPRINGEVERTEC, Inc. |
| EXTREME NETWORKS INC |
TANGOEFARO TECHNOLOGIES INC |
| FIDESSA GROUP PLC |
| FINISAR CORP |
| FORESCOUT TECHNOLOGIES, INC |
| FORMFACTOR INC |
| GameStop Corp. |
| Groupon, Inc. |
| GTT Communications, Inc. |
| HEALTHEQUITY INC |
| HUBSPOT INC |
| II-VI INC |
| INFINERA Corp |
| INNOVIVA, INC. |
| INSIGHT ENTERPRISES INC |
| INSTRUCTURE INC |
| INTEGRATED DEVICE TECHNOLOGY INC |
| InterDigital, Inc. |
| INTERSIL CORP/DE |
| ITRON INC /WA/ |
| J2 GLOBAL, INC. |
| JABIL INC |
| KEMET CORP |
| LORAL SPACE & COMMUNICATIONS INC. |
| MACOM TECHNOLOGY SOLUTIONS HOLDINGS, INC. |
| MANHATTAN ASSOCIATES INC |
| Medidata Solutions, Inc. |
| Mellanox Technologies, Ltd. |
|
|
| MERCURY SYSTEMS INC |
| MICROSTRATEGY INC |
| MongoDB, Inc. |
| Morningstar, Inc. |
| NETGEAR, INC |
| NEUSTAR INC |
| NEW RELIC INC |
| NOVANTA INC |
| OCLARO, INC. |
| OMNICELL, Inc |
| PLANTRONICS INC /CA/ |
| PLEXUS CORP |
| Premier, Inc. |
| Presidio, Inc. |
| PROS HOLDINGS, INC. |
| Pure Storage, Inc. |
| Q2 Holdings, Inc. |
| QUEBECOR, INC. |
| RAMBUS INC |
| REALPAGE INC |
| SANMINA CORP |
| SEMTECH CORP |
| SENDGRID, INC. |
| SILICON LABORATORIES INC |
| SOLAREDGE TECHNOLOGIES INC |
| SPS COMMERCE INC |
| SYKES ENTERPRISES INC |
| SYNAPTICS INC |
| SYSTEMAX INC |
| TECH DATA CORP |
| TIVO CORP |
| TrueCar, Inc. |
| TTM TECHNOLOGIES INC |
| UNITED STATES CELLULAR CORP |
| VARONIS SYSTEMS INC |
ZENDESK,VERINT SYSTEMS INC |
| VIASAT INC |
| VISHAY INTERTECHNOLOGY INC |
| VONAGE HOLDINGS CORP |
| WebMD Health Corp. |
| WEST CORP |
| WORKIVA INC |
| XPERI CORP |
| ZYNGA INC |
For our president:
|
|
| Company |
| ALLSCRIPTS HEALTHCARE SOLUTIONS, INC. |
| BOX INC |
| DESCARTES SYSTEMS GROUP INC |
| DUN & BRADSTREET CORP/NW |
| FireEye, Inc. |
| HUBSPOT INC |
| Inovalon Holdings, Inc. |
| J2 GLOBAL, INC. |
| JABIL INC |
| MANTECH INTERNATIONAL CORP |
| MENTOR GRAPHICS CORP |
| Morningstar, Inc. |
| NEW RELIC INC |
| Pure Storage, Inc. |
| Quotient Technology Inc. |
| Sailpoint Technologies Holdings, Inc. |
| VIASAT INC |
| WEST CORP |
For our chief technology officer
|
|
| Company |
| 2U, Inc. |
| ACI WORLDWIDE, INC. |
| AVX Corp |
| BOINGO WIRELESS INC |
| CABOT MICROELECTRONICS CORP |
| CALLIDUS SOFTWARE INC |
| CIENA CORP |
| Casa Systems Inc |
| Cornerstone OnDemand Inc |
| DUN & BRADSTREET CORP/NW |
| ETSY INC |
| FINISAR CORP |
| Gigamon Inc. |
| Gigamon Inc. |
| INNOVIVA, INC. |
| Inovalon Holdings, Inc. |
| MICROSTRATEGY INC |
| MINDBODY, Inc. |
| PEGASYSTEMS INC |
| Presidio, Inc. |
| Q2 Holdings, Inc. |
| ROGERS CORP |
| SILICON LABORATORIES INC |
| Straight Path Communications Inc. |
| UNITED STATES CELLULAR CORP |
| VISHAY INTERTECHNOLOGY INC |
| VONAGE HOLDINGS CORP |
For our chief marketing officer
|
|
| Company |
| 2U, Inc. |
| BOINGO WIRELESS INC |
| BROADSOFT, INC. |
| CABOT MICROELECTRONICS CORP |
| MENTOR GRAPHICS CORP |
| GameStop Corp. |
| TrueCar, Inc. |
For our chief product officer
|
|
| Company |
| 8X8 INC /DE/ |
| ALLSCRIPTS HEALTHCARE SOLUTIONS, INC. |
| Alarm.com Holdings, Inc. |
| BENCHMARK ELECTRONICS INC |
| BOINGO WIRELESS INC |
| CSG SYSTEMS INTERNATIONAL INC |
| Casa Systems Inc |
| DESCARTES SYSTEMS GROUP INC |
| FINISAR CORP |
| Groupon, Inc. |
| HEALTHEQUITY INC |
| INTERSIL CORP/DE |
| KINAXIS INC. |
| MACOM TECHNOLOGY SOLUTIONS HOLDINGS, INC. |
| MULESOFT, INC |
| NETGEAR, INC |
| NEW RELIC INC |
| PLANTRONICS INC /CA/ |
| Q2 Holdings, Inc. |
| QUALYS, INC. |
| SILICON LABORATORIES INC |
| SYNAPTICS INC |
| UNITED STATES CELLULAR CORP |
| VONAGE HOLDINGS CORP |
| XPERI CORP |
Annex C
(2014 AmendmentNon-GAAP Financial Measures)
2017 Detailed Results
2017 total revenue was $468.7 million, up 29% compared to 2016. 2017 Mailing and Shipping revenue (which includes service, product and insurance revenue but excludes Customized Postage and Other revenue) was $449.4 million, up 28% versus 2016. 2017 Customized Postage revenue was $19.2 million, up 41% versus 2016.
2017 GAAP income from operations was $163.5 million, GAAP net income was $150.6 million and GAAP net income per share was $8.19 based on 18.4 million fully diluted shares outstanding. This compares to a 2016 GAAP income from operations of $120.2 million, GAAP net income of $75.2 million and GAAP net income per share of $4.12 based on fully diluted shares outstanding of 18.3 million. 2017 GAAP income from operations, GAAP net income and GAAP income per fully diluted share increased by 36%, 100%, and 99% year-over-year, respectively.
2017 GAAP income from operations included $40.8 million of non-cash stock-based compensation expense, $16.0 million of non-cash amortization of acquired intangibles, $6.0 million of executive consulting expense, and $1.9 million of one-time insurance proceeds relating to a prior legal settlement. 2017 GAAP net income also included $374 thousand of non-cash amortization of debt issuance costs. 2017 GAAP income tax expense was $9.6 million and non-GAAP income tax expense was $13.3 million resulting in a non-GAAP tax expense adjustment of $3.7 million. The non-GAAP tax expense adjustment primarily reflects the tax impact from higher non-GAAP income as compared to GAAP income at the effective tax rate for fiscal 2017. See the sections later in this press release entitled “About Non-GAAP Financial Measures” for more information on how non-GAAP taxes are calculated. Excluding the non-cash stock-based compensation expense, non-cash amortization of acquired intangibles, executive consulting expense, and one-time insurance proceeds, 2017 non-GAAP income from operations was $224.5 million. Also excluding non-cash amortization of debt issuance costs and including the non-GAAP tax expense adjustment, 2017 non-GAAP adjusted income was $208.2 million or $11.33 per share based on 18.4 million fully diluted shares outstanding.
2016 GAAP income from operations included $33.9 million of non-cash stock-based compensation expense, $14.6 million of non-cash amortization of acquired intangibles, and $1.1 million of expenses related to the ShippingEasy acquisition. 2016 GAAP net income also included $374 thousand of non-cash amortization of debt issuance costs and $33.6 million of non-cash income tax expense. Excluding the non-cash stock-based compensation expense, non-cash amortization of acquired intangibles, and acquisition related expenses, 2016 non-GAAP income from operations was $169.8 million. Also excluding non-cash amortization of debt issuance costs and non-cash income tax expense, 2016 non-GAAP adjusted income was $158.8 million or $8.70 per share based on 18.3 million fully diluted shares outstanding.
Non-GAAP income from operations, non-GAAP adjusted income and non-GAAP adjusted income per share are described further in the “About Non-GAAP Financial Measures” section of this Annex C and are reconciled to the corresponding GAAP measures in the following tables (unaudited):
Reconciliation of Non-GAAP to GAAP Financial Measures (2017)
|
| | | | | | | | | | | | | | | | |
| For the Year Ended December 31, 2017 | | | | Stock-Based | | Intangible | | Executive | | One-time | | Debt | | | | |
| All amounts in millions except | | GAAP | | Compen-sation | | Amorti-zation | | Consulting | | Insurance | | Amorti-zation | | Income Tax | | Non-GAAP |
| per share data: | | Amounts | | Expense | | Expense | | Expenses | | Proceeds | | Expense | | Adjustments | | Amounts |
| | | | | | | | | | | | | | | | | |
| Cost of Revenues | | $ 79.23 | | $ 1.77 | | 0 | | 0 | | 0 | | 0 | | 0 | | $ 77.45 |
| Research & Development | | 46.21 | | 9.03 | | 0 | | 0 | | 0 | | 0 | | 0 | | 37.17 |
| Sales & Marketing | | 91.22 | | 7.29 | | 0 | | 0 | | 0 | | 0 | | 0 | | 83.93 |
| General & Administrative | | 88.55 | | 22.73 | | 15.99 | | 6.00 | | (1.86) | | 0 | | 0 | | 45.68 |
| Total Expenses | | 305.21 | | 40.83 | | 15.99 | | 6.00 | | (1.86) | | 0 | | 0 | | 244.24 |
| | | | | | | | | | | | | | | | | |
| Income (Loss) from Operations | | 163.50 | | (40.83) | | (15.99) | | (6.00) | | 1.86 | | 0 | | 0 | | 224.46 |
| | | | | | | | | | | | | | | | | |
| Interest and Other Income (Loss) | | (3.26) | | 0 | | 0 | | 0 | | 0 | | (0.37) | | 0 | | (2.88) |
| | | | | | | | | | | | | | | | | |
| Benefit (Expense) for Income Taxes | | (9.65) | | 0 | | 0 | | 0 | | 0 | | 0 | | 3.69 | | (13.34) |
| | | | | | | | | | | | | | | | | |
| Adjusted Income (Loss) | | 150.60 | | (40.83) | | (15.99) | | (6.00) | | 1.86 | | (0.37) | | 3.69 | | 208.24 |
| | | | | | | | | | | | | | | | | |
| On a diluted per share basis | | $ 8.19 | | $ (2.22) | | $ (0.87) | | $ (0.33) | | $ 0.10 | | $ (0.02) | | $ 0.20 | | $ 11.33 |
| | | | | | | | | | | | | | | | | |
Reconciliation of Non-GAAP to GAAP Financial Measures (2016)
|
| | | | | | | | | | | | | | |
| For the Year Ended | | | | Stock-Based | | Intangible | | Acquisition | | Debt | | Income Tax | | |
December 31, 2016 All amounts in millions | | GAAP | | Compen-sation | | Amorti-zation | | Related | | Amorti-zation | | Benefit | | Non-GAAP |
| except per share data: | | Amounts | | Expense | | Expense | | Expenses | | Expense | | (Expense) | | Amounts |
| | | | | | | | | | | | | | | |
| Cost of Revenues | | $ 62.97 | | $ 1.83 | | 0 | | 0 | | 0 | | 0 | | $ 61.14 |
| Research & Development | | 35.16 | | 6.63 | | 0 | | 0 | | 0 | | 0 | | 28.52 |
| Sales & Marketing | | 78.83 | | 7.19 | | 0 | | 0 | | 0 | | 0 | | 71.64 |
| General & Administrative | | 67.12 | | 18.29 | | 14.56 | | 1.08 | | 0 | | 0 | | 33.20 |
| Total Expenses | | 244.08 | | 33.95 | | 14.56 | | 1.08 | | 0 | | 0 | | 194.50 |
| | | | | | | | | | | | | | | |
| Income (Loss) from Operations | | 120.22 | | (33.95) | | (14.56) | | (1.08) | | 0 | | 0 | | 169.80 |
| | | | | | | | | | | | | | | |
| Interest and Other Income (Loss) | | (3.25) | | 0 | | 0 | | 0 | | (0.37) | | 0 | | (2.87) |
| | | | | | | | | | | | | | | |
| Benefit (Expense) for Income Taxes* | | (41.74) | | 0 | | 0 | | 0 | | 0 | | (33.62) | | (8.12) |
| | | | | | | | | | | | | | | |
| Adjusted Income (Loss) | | 75.23 | | (33.95) | | (14.56) | | (1.08) | | (0.37) | | (33.62) | | 158.81 |
| | | | | | | | | | | | | | | |
| On a diluted per share basis | | $ 4.12 | | $ (1.86) | | $ (0.80) | | $ (0.06) | | $ (0.02) | | $ (1.84) | | $ 8.70 |
| | | | | | | | | | | | | | | |
* For 2016, the Company incurred approximately $33.6 million in deferred income tax expense based on its GAAP income measures. In addition, the Company would have incurred an additional approximately $14 million of deferred income tax expense based on its non-GAAP income measures.
2017 GAAP Net Income and Non-GAAP Adjusted EBITDA
2017 GAAP net income was $150.6 million, up 100% compared to $75.2 million in 2016.
2017 non-GAAP adjusted EBITDA was $229.9 million, up 32% compared to $174.4 million in 2016.
Adjusted EBITDA is a non-GAAP financial measure which is described further in the “About Non-GAAP Financial Measures” section of this Annex C and is reconciled to GAAP net income in the following table (unaudited):
Reconciliation of Non-GAAP Adjusted EBITDA to GAAP Net Income (Unaudited)
|
| | | | | |
| | | Twelve Months ended | |
| All amounts in millions | December 31, | |
| | | 2017 | | 2016 | |
| | | | | | |
| GAAP Net Income (Loss) | $150.60 | | $75.23 | |
| | | | | | |
| Depreciation and Amortization expense | $21.44 | | $19.17 | |
| Interest & Other Expense (Income), net | $3.26 | | $3.25 | |
| Income Tax Expense (Benefit), net | $9.65 | | $41.74 | |
| | | | | | |
| Stock-based Compensation Expense | $40.83 | | $33.95 | |
| Executive Consulting Expense | $6.00 | | $ -- | |
| One-time Insurance Expense (Proceeds) | ($1.86) | | $ -- | |
| Acquisition Related Expenses | $ -- | | $1.08 | |
| | | | | | |
| Adjusted EBITDA | $ 229.92 | | $ 174.41 | |
| | | | | | |
About Non-GAAP Financial Measures
To supplement the Stamps.com Inc.’s (the “Company’s”) condensed consolidated financial statements presented in accordance with GAAP, the Company uses non-GAAP measures of certain components of financial performance. These non-GAAP measures include non-GAAP income from operations, non-GAAP adjusted income, non-GAAP adjusted income per fully diluted share and adjusted EBITDA. Non-GAAP adjusted income per fully diluted share is calculated as adjusted non-GAAP net income divided by fully diluted shares. Prior to the second quarter 2016, the Company referred to non-GAAP adjusted income as non-GAAP net income. Adjusted EBITDA as calculated by the Company represents earnings before interest and other expense, net, interest and other income, net, income tax expense or benefit, depreciation and amortization and excludes certain items, such as stock-based compensation expense (described in the Company’s press release issued on February 21, 2018 and exhibited to the Company’s Current Report on Form 8-K filed on February 22, 2018), used to reconcile GAAP to non-GAAP income from operations. The presentation of non-GAAP financial measures is not intended to be considered in isolation or as a substitute for, or superior to, the financial information prepared and presented in accordance with GAAP. These non-GAAP financial measures may differ from similarly titled measures used by other companies. Reconciliation of non-GAAP financial measures used in this Proxy Statement to the corresponding GAAP measures can be found in the financial tables in this Annex C.
Non-GAAP financial measures are provided to enhance investors’ overall understanding of the Company’s financial performance and prospects for the future and as a means to evaluate period-to-period comparisons. The Company believes the non-GAAP measures that exclude certain non-cash items including stock-based compensation expense, amortization of acquired intangibles, amortization of debt issuance costs, contingent consideration charges and income tax adjustments, and exclude certain expenses such as acquisition related expenses and litigation settlement expenses, provide meaningful supplemental information regarding financial performance by excluding certain
expenses and benefits that may not be reflective of core business operating results. The Company believes that non-GAAP financial measures, when viewed with GAAP results and the accompanying reconciliation, enhance the comparability of results against prior periods and allow for greater transparency of financial results. Management uses non-GAAP financial measures in making financial, operating, compensation and planning decisions. The Company believes non-GAAP financial measures facilitate management and investors comparison of the Company’s financial performance to that of prior periods as well as trend analysis over time.
ANNEX D
(Stamps.com Inc. 2010 Equity Incentive
Plan)Plan and the
2014 Amendment and
2016 Amendment thereto)
STAMPS.COM INC.
2010 EQUITY INCENTIVE PLAN
1. PURPOSE.
The purposes of this Plan are to attract, motivate, and retain Employees, Directors, and Consultants of Stamps.com Inc. and its Subsidiaries; to offer selected Employees, Directors, and Consultants the opportunity to acquire proprietary interests in the Company by purchasing or receiving shares of the Company's Stock or other similar rights; and to promote the success of the Company. This Plan provides for the grant of Nonstatutory Options, Incentive Stock Options, Stock Appreciation Rights, Restricted Stock, and Restricted Stock Units. This Plan also is intended to provide shares of Stock for Awards granted to Employees, Consultants and Directors under other compensation plans offered by the Company and its Subsidiaries.
2. DEFINITIONS.
“Affiliated SAR” means a SAR granted in connection with an Option such that the exercise of the Option does not cancel the SAR, but rather results in the exercise of the SAR.
“Applicable Laws” means the requirements relating to the administration of stock plans under U.S. state corporate laws, U.S. federal and state securities laws, the Code, the rules and regulations of any stock exchange or quotation system on which the Stock is listed or quoted, and other similar laws.
“Award” means, individually or collectively, a grant under this Plan of Options, Stock Appreciation Rights, Restricted Stock, and Restricted Stock Units.
“Award Agreement” means the written agreement setting forth the terms and provisions applicable to each Award granted under this Plan. The Award Agreement is subject to the terms and conditions of this Plan and shall include, among other things, the following information, if applicable to the Award: (i) Exercise Price, (ii) number of shares of Stock or Stock equivalents, (iii) exercise schedule, (iv) vesting schedule, (v) restrictions, (vi) dates and conditions for lapse of restrictions, and (vii) expiration dates.
“Board” means the Board of Directors of the Company.
“Cause” means (A) if the Participant is a party to an employment or other similar service agreement with the Company (a “Service Agreement”), and “cause” is defined therein, such definition, or (B) if the Participant is not party to a Service Agreement or the Participant's Service Agreement does not define “cause”, then Cause means any of the following:
(i) the Participant's material breach of his fiduciary duty to the Company,
(ii) the Participant's indictment (or equivalent) for a felony or other serious crime, or
(iii) the Participant's commission of a wrongful act that would make the continuance of his employment by the Company detrimental to the Company.
“Change in Control” means the first to occur of any of the following events:
(i) The date on which any one person or entity, or more than one person or entity acting as a group, becomes the beneficial owner (as that term is used in Section 13(d) of the Exchange Act), directly or indirectly, of more than fifty percent (50%) of the capital stock of the Company entitled to vote in the election of Directors, other than a group of two or more persons or entities not (A) acting in concert for the purpose of acquiring, holding or disposing of such stock or (B) otherwise required to file any form or report with any governmental agency or regulatory authority having jurisdiction over the Company that requires the reporting of any change in control. The acquisition of additional Stock by any person or entity who immediately prior to such acquisition already is the beneficial owner of more than fifty percent (50%) of the Stock of the Company entitled to vote in the election of Directors is not a Change in Control.
(ii) During any period of not more than twenty four (24) consecutive months during which the Company continues in existence, not including any period prior to the effective date of this Plan, individuals who, at the beginning of such period, constitute the Board, and any new Director (other than a Director designated by a person or entity who has entered into an agreement with the Company to effect a transaction described in clause (i) or (iii) of this definition of `Change in Control`) whose appointment to the Board or nomination for election to the Board was approved by a vote of a majority of the Directors then still in office, either were Directors at the beginning of such period or whose appointment or nomination for election was previously so approved, cease for any reason to constitute at least a majority of the Board.
(iii) The date on which any one person or entity, or more than one person or entity acting as a group, acquires (or has acquired during the twelve month period ending on the date of the most recent acquisition by such person(s) or entity(ies)) assets from the Company that have a total gross fair market value greater than 50% of the total gross fair market value of all of the Company's assets immediately before the acquisition or acquisitions; provided, however, transfer of assets that otherwise would satisfy the requirements of this subsection (iii) will not be treated as a Change in Control if the assets are transferred to:
(A) a stockholder of the Company (immediately before the asset transfer) in exchange for or with respect to its stock;
(B) an entity, 50% or more of the total value or voting power of which is owned, directly or indirectly, by the Company;
(C) a person or entity, or more than one person or entity acting as a group, that owns, directly or indirectly, 50% or more of the total value or voting power of all the outstanding stock of the Company; or
(D) an entity, at least 50% of the total value or voting power of which is owned, directly or indirectly by a person or entity, or more than one person or entity acting as a group, that owns, directly or indirectly, 50% or more of the total value or voting power of all the outstanding stock of the Company.
If the Change in Control constitutes a payment event with respect to any Award that provides for the deferral of compensation and is subject to Section 409A of the Code, then to the extent required (i) the event constituting a Change in Control is intended to constitute a “change in ownership or effective control” or a “change in the ownership of a substantial portion of the assets” of the Company as such terms are defined for purposes of Section 409A of the Code and (ii) “Change in Control” as used herein shall be interpreted consistently therewith.
“Code” means the Internal Revenue Code of 1986, as amended.
“Committee” means a committee or subcommittee of the Board, described in Section 4.1, or in the absence of such a committee, the Board.
“Company” means Stamps.com Inc., a Delaware corporation.
“Consultant” means any individual or entity, other than an Employee or Director, who provides services to the Company or a Subsidiary in the capacity of an advisor or consultant.
“Director” means a member of the Board.
“Disability” means a medically determinable physical or mental impairment that can be expected to result in death or can be expected to last for a continuous period of not less than twelve (12) months and that:
(i) renders the Participant unable to engage in any substantial gainful activity; or
(ii) results in the Participant receiving income replacement benefits for a period of not less than three (3) months under any policy of long-term disability insurance maintained by the Company for the benefit of its employees.
Disability shall be interpreted in a manner consistent with Section 409A of the Code and shall be determined by the Committee in its sole discretion, after consideration of such evidence as it may require, including a report or reports of such physician or physicians as the Committee may designate.
“Domestic Relations Order” means a “domestic relations order” as defined in Section 414(p)(1)(B) of the Code.
“Employee” means any individual employed by the Company or by a Subsidiary and reflected as an employee on a payroll of the Company or of a Subsidiary.
“Exchange Act” means the Securities Exchange Act of 1934, as amended.
“Exercise Price” means the amount specified per share of Stock, at which Stock may be purchased on exercise of an Option or above which payment is to be made on exercise of a Stock Appreciation Right, in each case as specified by the Committee in the applicable Award Agreement.
“Fair Market Value” of the Stock on any given date under this Plan shall be determined as follows:
(i) If the Stock is at the time readily tradable on an established securities market, then the fair market value shall be the closing selling price per share of the Stock on the date of determination on the securities market determined by the Committee to be the primary market for the Stock, as such price is officially quoted in the composite tape transactions on such market. If there is no reported sale of the Stock on such market on the date of determination, then the fair market value shall be the closing price on such market on the last preceding date for which such quotation exists; or
(ii) If the Stock is at the time not readily tradable on an established securities market, then the fair market value shall be determined by the Committee by the reasonable application of a reasonable valuation method, taking into account such considerations as may be applicable for purposes of or specified in Section 409A of the Code and Treasury Regulations thereunder.
“Freestanding SAR” means a SAR granted as an independent Award and not granted in connection with an Option.
“Grant Date” means, with respect to an Award, the date of the Committee action granting the Award or such later date as is specified in the Award Agreement.
“Grantee” means an individual who holds a Restricted Stock Award, RSU Award or Stock Appreciation Right Award.
“Incentive Stock Option” or “ISO” means an Option intended to qualify as an “incentive stock option” within the meaning of Section 422 of the Code and the regulations promulgated thereunder.
“Nonstatutory Option” means a stock option not described in Section 422(b) or 423(b) of the Code.
“Option” means an ISO or Nonstatutory Option granted under this Plan and entitling the holder to purchase shares of Stock.
“Optionee” means an individual or entity that holds an Option.
“Other Incentive Plan” means any short-term or long-term bonus or other incentive compensation plan offered by the Company or a Subsidiary, through which the Company or the Subsidiary may pay benefits in Awards or shares of Stock under this Plan.
“Outside Director” means a Director who is not an Employee and who is an “outside director” within the meaning of Section 162(m) of the Code.
“Participant” means the holder of an outstanding Award.
“Performance-Based Award” means an Award granted pursuant to Section 7, 8, 9 or 10, but that is subject to the terms and conditions set forth in Section 11. All Performance-Based Awards are intended to qualify as Qualified Performance-Based Compensation.
“Performance Criteria” means the factor or factors utilized by the Committee in establishing the Performance Goals applicable to an Award, from among the following measures:
(i) revenue;
(ii) gross profit or margin;
(iii) operating profit or margin;
(iv) earnings before or after interest, taxes, depreciation, and/or amortization;
(v) net earnings or net income (before or after taxes);
(vi) earnings per share;
(vii) share price (including, but not limited to, growth measures and total stockholder return);
(viii) cost reduction or savings;
(ix) return measures (including, but not limited to, return on assets, capital, invested capital, equity, sales or revenue);
(x) cash flow (including, but not limited to, operating cash flow, free cash flow, cash flow return on equity and cash flow return on investment);
(xi) productivity ratios or other metrics;
(xii) performance against budget;
(xiii) market share;
(xiv) working capital targets;
(xv) economic value added (net operating profit after tax minus the sum of capital multiplied by the cost of capital);
(xvi) financial ratio metrics; and
(xvii) organizational/transformation metrics.
The Performance Criteria utilized may differ from Participant to Participant and from Award to Award. Any Performance Criteria, or any combination thereof, may be used to measure the performance of the Company or any Subsidiary, as a whole, or any business unit of the Company, or any Subsidiary, as the Committee deems appropriate. Performance Criteria may be measured in absolute terms or may be compared to (i) the performance of a group of comparative companies, (ii) a published or special index that the Committee deems appropriate, (iii) with respect to return measures (including, but not limited to, return on assets, capital, invested capital, equity, sales or revenue), various stock market indices and/or (iv) other benchmarks approved by the Committee.
“Performance Goals” means the goals established in writing by the Committee for a Performance Period based upon Performance Criteria selected by the Committee. The Performance Goals may be expressed in terms of overall Company performance or the performance of a division, business unit, or an individual. The Committee, in its discretion, may, within the time prescribed by Section 162(m) of the Code, adjust or modify the calculation of Performance Goals for a Performance Period in order to prevent the dilution or enlargement of the rights of Participants (i) in the event of, or in anticipation of, any unusual or extraordinary corporate item, transaction, event, or development, or (ii) in recognition of, or in anticipation of, any other unusual or nonrecurring events affecting the Company, or the financial statements of the Company, or in response to, or in anticipation of, changes in applicable laws, regulations, accounting principles, or business conditions.
“Performance Period” means the one or more periods of time, which may be of varying and overlapping durations, as the Committee may select, over which the attainment of one or more Performance Goals will be measured for the purpose of determining a Participant's right to, and the payment of, a Performance-Based Award.
“Plan” means this Stamps.com Inc. 2010 Equity Incentive Plan, as it may be amended from time to time.
“Qualified Performance-Based Compensation” means any compensation that is “payable solely on account of the attainment of one or more performance goals” as described in and meeting the requirements of Section 162(m)(4)(C) of the Code.
“Restricted Stock” means an Award granted pursuant to Section 9 of shares of Stock subject to conditions or restrictions set by the Committee.
“Restricted Stock Unit” or “RSU” means an Award granted pursuant to Section 10 to receive Stock or the economic equivalent of Stock subject to conditions or restrictions set by the Committee, without the issuance of Stock at the time of grant.
“Stock” means the common stock of the Company.
“Stock Appreciation Right” or “SAR” means an Award granted pursuant to Section 8 to receive the appreciation in the Fair Market Value of Stock following the Grant Date, which may be granted alone (as a Freestanding SAR) or in connection with a related Option (as either an Affiliated SAR or a Tandem SAR).
“Subsidiary” means any corporation in which the Company and/or one or more other Subsidiaries own fifty percent (50%) or more of the total combined voting power of all classes of outstanding stock of such corporation. A corporation that attains the status of a Subsidiary on a date after the adoption of this Plan shall be considered a Subsidiary commencing as of the date such status is attained.
“Tandem SAR” means a SAR granted in connection with a related Option such that the exercise of the SAR requires the surrender of the related Option and the exercise of the related Option requires the surrender of the SAR.
“Termination of Service” means (i) in the case of an Employee, a cessation of the employee-employer relationship between the Employee and the Company or a Subsidiary for any reason, including, but not by way of limitation, a termination by resignation, discharge, death, Disability, or the disaffiliation of a Subsidiary from the Company, but excluding any such termination where there is a simultaneous commencement or continuation of status as a Consultant or as a Director; (ii) in the case of a Consultant, a cessation of the service relationship between the Consultant and the Company or a Subsidiary for any reason, including, but not by way of limitation, a termination by resignation, discharge, death, Disability, or the disaffiliation of a Subsidiary, but excluding any such termination where there is a simultaneous commencement or continuation of status as an Employee or as a Director; and (iii) in the case of a Director, a cessation of the Director's service on the Board for any reason, including, but not by way of limitation, a termination by resignation, death, Disability, or non-reelection to the Board, but excluding any such termination where there is a simultaneous commencement or continuation of status as an Employee or as a Consultant. A transfer in employment or other service relationship from the Company to a Subsidiary or from a Subsidiary to the Company, or from one Subsidiary to another shall not be considered a Termination of Service. With respect to any Award that may provide for nonqualified deferred compensation subject to Section 409A of the Code, whether Termination of Service has occurred shall be determined based on whether the facts and circumstances indicate that the Company and the Employee, Director or Consultant reasonably anticipate that no further services will be performed after a certain date or that the level of bona fide services the Employee, Director or Consultant would perform after such date would permanently decrease to no more than twenty percent (20%) of the average level of bona fide services performed over the immediately preceding 36 months (or the full period of service if less than thirty six (36) months), and such determination shall be made in accordance with Section 409A of the Code and the Treasury Regulations thereunder.
“Year” means a fiscal year of the Company.
3. STOCK SUBJECT TO PLAN; LIMITATIONS.
3.1. Maximum Plan Shares. The maximum aggregate number of shares of Stock and Stock equivalents reserved and available for the grant of Awards under this Plan is three million five hundred thousand (3,500,000) shares, calculated in accordance with Section 3.2. For purposes of this limitation, the shares of Stock and Stock equivalents underlying any Awards that expire unexercised or that are forfeited, canceled, reacquired by the Company at cost, satisfied without the issuance of Stock or payment of cash, or otherwise terminated (other than by exercise) shall be added back to the shares of Stock and Stock equivalents available for grant under this Plan. Shares of Stock and Stock equivalents (i) tendered by a Participant to pay the exercise price of an Award, (ii) withheld by the Company for taxes or (iii) repurchased by the Company with any cash proceeds from option exercises shall notbe added back to the shares of Stock and Stock equivalents available for grant under this Plan. Stock-settled SARs are counted on a gross and not a net basis. The shares of Stock available for issuance under this Plan may be authorized but unissued shares of Stock or shares of Stock reacquired by the Company.
3.2. Effect of Awards. For purposes of determining the number of shares of Stock and Stock equivalents available for issuance under Section 3.1, the impact of any Awards shall be determined by multiplying the number of shares of Stock or Stock equivalents underlying such grant by the multiplier below:
|
| | | | |
| | |
| Type of Award | | Multiplier |
| Award of Restricted Stock or Restricted Stock Units that delivers the full value of the underlying shares of Stock | | | 2.0 | |
| Award of Options or Stock Appreciation Rights that delivers the value of the underlying shares of Stock in excess of 100% of the Fair Market Value of the underlying shares of Stock (e.g., Options with an exercise price of at least 100% of such price) on the date of grant | | | 1.0 | |
3.3. Individual Award Limitations. In addition to the overall limitations set forth in Section 3.1, Awards granted to any one Participant during any one calendar year period shall not exceed seven hundred thousand (700,000) shares of Stock and Stock equivalents.
3.4. No Double Counting Tandem SARs. For purposes of the limitations set forth in Sections 3.1 and 3.3, the shares of Stock and Stock equivalents subject to a Tandem SAR and its related Option shall be counted only once.
4. ADMINISTRATION.
4.1. Establishment of Committee. The Board shall have the authority to administer this Plan, but may delegate its administrative powers under this Plan, in whole or in part, to a committee of the Board or to a subcommittee of any such committee of the Board.
4.2. Committee Procedures. The Board (or in absence of action by the Board, the Committee)shall designate one of the members of each Committee as chairman. Any such Committee may hold meetings at such times and places as its chairman or a majority of the members of the Committee shall determine. The acts of a majority of the Committee members present at meetings at which a quorum exists, or acts reduced to or approved in writing by all Committee members, shall be valid acts of the Committee.
4.3. Section 162(m) Committee. Any Awards that are intended to be Qualified Performance-Based Compensation shall be granted and, as it relates to such Awards, this Plan shall be administered by a Committee of two or more Outside Directors.
4.4. Rule 16b-3 Committee. Any Awards to Participants who are subject to Section 16 of the Exchange Act shall be granted and, as it relates to such Awards, this Plan shall be administered by a Committee of two or more members of the Board who qualify as “Non-Employee Directors” as defined in Rule 16b-3 under the Exchange Act, and such Awards shall be structured to satisfy the requirements for exemption under Rule 16b-3 under the Exchange Act.
4.5. Committee Responsibilities. Subject to the provisions of this Plan, the Committee shall have full authority and discretion to take the following actions:
|
| | |
| (i) | To interpret this Plan and to apply its provisions; |
|
| | |
| (ii) | To adopt, amend, or rescind rules, procedures, agreements and forms relating to this Plan; |
|
| | |
| (iii) | To authorize any person to execute, on behalf of the Company, any instrument (including, but not limited to any Award Agreement) required to carry out the purposes of this Plan; |
|
| | |
| (iv) | To determine when Awards are to be granted under this Plan; |
|
| | |
| (v) | To select the Participants; |
| (vi) | To determine the number of shares of Stock or Stock equivalents to be made subject to each Award; |
|
| | |
| (vii) | To prescribe the terms and conditions (including vesting and acceleration) of each Option and SAR on the Grant Date, including (without limitation) the Exercise Price, to determine whether each such Option is to be classified as an ISO or as a Nonstatutory Option, to determine whether each such SAR is to be settled in Stock or in cash, and to specify the provisions of the Award Agreement relating to such Option or SAR; |
|
| | |
| (viii) | To prescribe the terms and conditions (including vesting and acceleration) of each Restricted Stock Award and RSU Award on the Grant Date, including (without limitation) restrictions (if any), to specify whether each such Restricted Stock Awards and RSU Award is to be settled in Stock or in cash, and to specify the provisions of the Award Agreement relating to such Restricted Stock Award or RSU Award; |
|
| | |
| (ix) | To amend any outstanding Award Agreement (including vesting and acceleration), subject to applicable legal restrictions, the provisions of this Plan and the terms and conditions of such Award Agreement; |
|
| | |
| (x) | To prescribe the consideration for the grant of each Award under this Plan and to determine the sufficiency of such consideration; and |
|
| | |
| (xi) | To take any other actions deemed necessary or advisable for the administration of this Plan. |
4.6. Indemnification. Each person who is or shall have been a member of the Committee, or of the Board, shall be indemnified and held harmless by the Company, to the fullest extent permitted by law, against and from (i) any loss, cost, liability, or expense that may be imposed upon or reasonably incurred by him or her in connection with or resulting from any claim, action, suit, or proceeding to which he or she may be a party or in which he or she may be involved by reason of any action taken or failure to act under this Plan or any Award Agreement, and (ii) from any and all amounts paid by him or her in settlement thereof, with the Company's approval, or paid by him or her in satisfaction of any judgment in any such claim, action, suit, or proceeding against him or her, provided he or she shall give the Company an opportunity, at its own expense, to handle and defend the same before he or she undertakes to handle and defend it on his or her own behalf. The foregoing right of indemnification shall not be exclusive of any other rights of indemnification to which such persons may be entitled under the Company's Certificate of Incorporation or Bylaws, by contract, as a matter of law, or otherwise, or under any power that the Company may have to indemnify them or hold them harmless.
5. ELIGIBILITY.
5.1. General Rules. Employees, Consultants and Directors shall be eligible for the grant of Awards as designated by the Committee. However, Consultants and Directors who are not also Employees shall not be eligible for the grant of ISOs.
5.2. Ten-Percent Stockholders. An Employee who owns more than ten percent (10%) of the total combined voting power of all classes of outstanding stock of the Company or any of its Subsidiaries shall not be eligible for the grant of an ISO unless:
|
| | |
| (i) | The Exercise Price is at least one hundred ten percent (110%) of the Fair Market Value of a share of Stock on the Grant Date; and |
|
| | |
| (ii) | Such ISO by its terms is not exercisable after the expiration of five (5) years from the Grant Date. |
5.3. Stock Ownership. For purposes of Section 5.2, in determining an Employee's stock ownership, the attribution rules of Section 424(d) of the Code shall apply. For purposes of Section 5.2, “outstanding stock” shall be determined under the rules pertaining to Section 422(b) of the Code and shall include all Stock actually issued and outstanding immediately after the grant, including Restricted Stock, but shall not include shares of Stock authorized for issuance under any Option that has not been exercised.
6. MODIFICATIONS AND RESTRICTIONS.
6.1. Amendment, Modification, Extension and Renewal of Awards. Within the limitations of this Plan, and subject to Section 6.2, the Committee may amend, modify, extend or renew outstanding Awards or may cancel or accept the cancellation of outstanding Awards in return for the grant of new Awards at the same or a different price. The foregoing notwithstanding, no amendment or modification of an Award shall, without the consent of the Participant, impair the Participant's rights or increase his or her obligations under such Award. A change in the tax consequences of an Award shall not be considered an impairment of rights or an increase in obligations under the Award.
6.2. Restriction on Repricing of Options and SARs. Subject to Section 15.1, no outstanding Option or SAR shall be amended to reduce its Exercise Price or cancelled and replaced with a new Award (of the same type or of any different type) having a lower Exercise Price (or other purchase price) for any reason, without the prior approval of the Company's stockholders entitled to vote at a meeting of stockholders.
6.3. No Reload Options or SARs. No Option or SAR shall provide for the automatic grant of replacement or reload Options or SARs upon the Optionee or Grantee exercising the Option or SAR and paying the Exercise Price by tendering shares of Stock, net exercise or otherwise.
7. OPTIONS.
7.1. Nature of Options. An Option is an Award entitling the Participant to purchase shares of Stock at the Exercise Price set on the Grant Date. Options granted under this Plan may be either ISOs or Nonstatutory Stock Options. However, notwithstanding any designation of an Option as an ISO, to the extent that the aggregate Fair Market Value of the shares of Stock with respect to which the Option and any previously granted Options (and any other previously granted options to acquire Stock under all other plans of the Company) are exercisable for the first time by the Optionee during any calendar year exceeds $100,000, the Option shall be treated as a Nonstatutory Option. Options may be based, at the discretion of the Committee, on continuing employment (or other business relationship) with the Company and its Subsidiaries and/or achievement of pre-established Performance Goals.
7.2. Exercise Price. The Exercise Price of an Option shall not be less than one hundred percent (100%) of the Fair Market Value of a share of Stock on the Grant Date, or such higher amount as is provided in Section 5.2 with respect to specified ISOs.
7.3. Exercisability. The exercise schedule of each Option shall be determined by the Committee in its sole discretion and shall be set forth in the Award Agreement; provided however, that in the event of the Optionee's Termination of Service, the Option shall be exercisable only to the extent the Option was exercisable on the date of such Termination of Service, unless otherwise specified in the Award Agreement.
7.4. Term. The term of each Option shall not exceed ten (10) years from the Grant Date. Subject to the preceding sentence, the Committee in its sole discretion shall determine and specify in the Award Agreement the date on which an Option is to expire. In the event of an Optionee's Termination of Service:
|
| | |
| (i) | As a result of such Optionee's death or Disability, the Option shall expire twelve (12) months (or such other period specified in the Award Agreement) after such death or Disability, but not later than the original expiration date specified in the Award Agreement. |
|
| | |
| (ii) | By the Company for Cause, the Option shall expire immediately after the Company's notice or advice of such Termination of Service is dispatched to the Optionee, but not later than the original expiration date specified in the Award Agreement. |
|
| | |
| (iii) | For any reason other than the Optionee's death or Disability or by the Company for Cause (except in connection with the events specified in Section 16, which will be governed by that section), the Option shall expire ninety (90) calendar days (or such other period specified in the Award Agreement) after such Termination of Service, but not later than the original expiration date specified in the Award Agreement. |
7.5. No Rights as a Stockholder. An Optionee, or a transferee of an Optionee, shall have no rights as a stockholder with respect to any shares of Stock covered by his or her Option until the issuance of a stock certificate for such shares of Stock.
8. STOCK APPRECIATION RIGHTS.
8.1. Nature of a SAR. A SAR is an Award entitling the Grantee to receive shares of Stock, cash, or a combination thereof, which shall be determined by the Committee on the Grant Date and set forth in the Award Agreement, having a value equal to the excess of the Fair Market Value of a share of Stock on the date of exercise over the per share Exercise Price set by the Committee on the Grant Date. The Committee may grant Affiliated SARs, Freestanding SARs, Tandem SARs, or any combination thereof. SARs may be based, at the discretion of the Committee, on continuing employment (or other business relationship) with the Company and its Subsidiaries and/or achievement of pre-established Performance Goals.
8.2. Exercise Price. The Exercise Price of a Freestanding SAR shall be not less than one hundred percent (100%) of the Fair Market Value of a share of Stock on the Grant Date. The Exercise Price of a Tandem SAR or an Affiliated SAR shall equal the Exercise Price of the related Option.
8.3. Exercise of Tandem SARs. Tandem SARs may be exercised for all or part of the shares of Stock subject to the related Option upon the surrender of the right to exercise the equivalent portion of the related Option. A Tandem
SAR may be exercised only with respect to the shares of Stock for which its related Option is then exercisable. With respect to a Tandem SAR granted in connection with an Incentive Stock Option: (i) the Tandem SAR shall expire no later than the expiration of the underlying Incentive Stock Option; (ii) the amount of the payout with respect to the Tandem SAR shall be no more than one hundred percent (100%) of the difference between the Exercise Price of the underlying Incentive Stock Option and the Fair Market Value of the shares of Stock subject to the underlying Incentive Stock Option at the time the Tandem SAR is exercised; and (iii) the Tandem SAR shall be exercisable only when the Fair Market Value of the shares of Stock subject to the Incentive Stock Option exceeds the Exercise Price of the Incentive Stock Option.
8.4. Exercise of Affiliated SARs. An Affiliated SAR shall be deemed to be exercised upon the exercise of the related Option. The deemed exercise of an Affiliated SAR shall not necessitate a reduction in the number of shares of Stock subject to the related Option.
8.5. Exercise of Freestanding SARs. Freestanding SARs shall be exercisable on such terms and conditions as the Committee, in its sole discretion, shall determine.
8.6. Term. The term of each SAR shall not exceed ten (10) years from the Grant Date. Subject to the preceding sentence, the Committee in its sole discretion shall determine and specify in the Award Agreement the date on which the SAR is to expire. In the event of a Participant's Termination of Service:
|
| | |
| (i) | As a result of such Participant's death or Disability, the SAR shall expire twelve (12) months (or such other period specified in the Award Agreement) after such death or Disability, but not later than the original expiration date specified in the Award Agreement. |
|
| | |
| (ii) | By the Company for Cause, the SAR shall expire immediately after the Company's notice or advice of such Termination of Service is dispatched to the Participant, but not later than the original expiration date specified in the Award Agreement. |
|
| | |
| (iii) | For any reason other than the Participant's death or Disability or by the Company for Cause (except in connection with the events specified in Section 16, which will be governed by that section), the Option shall expire ninety (90) calendar days (or such other period specified in the Award Agreement) after such Termination of Service, but not later than the original expiration date specified in the Award Agreement. |
8.7. No Rights as a Stockholder. A Participant, or a transferee of a Participant, shall have no rights as a stockholder with respect to any shares of Stock covered by his or her SAR until the issuance of a stock certificate for such shares of Stock.
9. RESTRICTED STOCK.
9.1. Nature of a Restricted Stock Award. A Restricted Stock Award is an Award of shares of Stock subject to such restrictions and conditions, at a purchase price, if any, and for such consideration, all as the Committee shall determine on the Grant Date. Restricted Stock issuances may be based, at the discretion of the Committee, on continuing employment (or other business relationship) with the Company and its Subsidiaries and/or achievement of pre-established Performance Goals.
9.2. Restrictions. The Committee shall determine at the time of grant, and shall specify in the Award Agreement, the restrictions on the Restricted Stock and the date(s) on which the restrictions shall lapse or the Performance Goals that are to be met to cause such restrictions to lapse. The conditions for lapse of any restrictions, and whether such conditions have been met, shall be determined by the Committee in its sole discretion.
9.3. Escrow of Restricted Stock. Until all restrictions have lapsed or been removed, the Secretary, or such other escrow holder as the Committee may appoint, shall retain custody of any certificates representing the Restricted Stock subject to the Award; provided, however, that in no event shall the Grantee have physical custody of any certificates representing shares of Restricted Stock awarded to him or her until all restrictions thereon have lapsed or been removed.
9.4. Termination of Service. In the event of Grantee's Termination of Service:
|
| | |
| (i) | As a result of Grantee's death or Disability, then, except as otherwise specified in the Award Agreement, the restrictions on the Restricted Stock subject to the Award shall lapse as to a pro rata portion of the shares of such Restricted Stock (net of any shares as to which the restrictions previously have lapsed), with such pro rata portion based on the ratio of the number of days between the Grant Date and the date of Termination of Service to the number of days between the Grant Date and the date on which all such restrictions were scheduled to lapse under the Award Agreement. In such event, the Grantee shall forfeit the balance of such Restricted Stock as to which the restrictions have not yet lapsed, and the Restricted Stock so forfeited shall be returned to the Company. |
|
| | |
| (ii) | By the Company for Cause, or as a result of any other event not specified in Section 9.4(i) (except in connection with the events specified in Section 16, which will be governed by that section), the portion of the Restricted Stock Award for which the restrictions have not lapsed as of the Termination of Service shall be forfeited immediately after the Company's notice or advice of such Termination of Service for Cause is dispatched to Grantee or on the date of Termination of Service for any other reason, except as otherwise specified in the Award Agreement. |
9.5. No Fractional Shares. In determining the number of shares of Restricted Stock for which the restrictions have lapsed, fractional shares shall be rounded down to the nearest whole number, provided that such fractional shares shall be aggregated and earned at such time as all restrictions lapse.
9.6. Rights as Stockholder. Upon delivery of the Restricted Stock to the escrow holder or other action taken by the Committee pursuant to Section 9.3), the Grantee shall have all the rights of a stockholder of the Company with respect to the Restricted Stock, subject to the restrictions and the Award Agreement, including the right to vote the Restricted Stock and the right to receive all dividends or other distributions paid or made with respect to the Restricted Stock; provided, however, that any additional shares of Restricted Stock to which Grantee shall be entitled as a result of stock dividends, stock splits, or any other form of recapitalization in respect of shares of Stock subject to restrictions shall also be subject to the restrictions until the restrictions on the underlying shares of Stock lapse.
10. RESTRICTED STOCK UNITS.
10.1. Nature of a Restricted Stock Unit. A Restricted Stock Unit is an Award entitling the Grantee to receive shares of Stock or the cash equivalent of the shares of Stock at a future date, subject to restrictions and conditions. The Committee shall determine on the Grant Date and shall specify in the Award Agreement for each Award of Restricted Stock Units whether the Award is to be settled in Stock or in cash and the consideration to be provided by the Grantee for such Award. Such Restricted Stock Unit issuances may be based, at the discretion of the Committee, on continuing employment (or other business relationship) with the Company and its Subsidiaries and/or achievement of pre-established Performance Goals.
10.2. Restrictions. The Committee shall determine at the time of grant, and shall specify in the Award Agreement, the restrictions on the Restricted Stock Units and the date(s) on which the restrictions shall lapse or the Performance Goals that are to be met to cause such restrictions to lapse. The conditions for lapse of any restrictions, and whether such conditions have been met, shall be determined by the Committee in its sole discretion.
10.3. Form and Timing of Payment of Restricted Stock Units. Payment of Restricted Stock Units will be made as soon as practicable after the lapse of the restrictions.
10.4. Termination of Service. In the event of Grantee's Termination of Service:
|
| | |
| (i) | As a result of Grantee's death or Disability, then, except as otherwise specified in the Award Agreement, the restrictions on the shares of Stock or Stock equivalents subject to the Restricted Stock Units shall lapse as to a pro rata portion of such Restricted Stock Units (net of any Restricted Stock Units as to which the restrictions previously have lapsed), with such pro rata portion based on the ratio of the number of days between the Grant Date and the date of Termination of Service to the number of days between the Grant Date and the date on which all such restrictions were scheduled to lapse under the Award Agreement. In such event, the Grantee shall forfeit the right to earn the balance of such Restricted Stock Units as to which the restrictions have not yet lapsed. |
|
| | |
| (ii) | By the Company for Cause, or as a result of any other event not specified in Section 10.4(i) (except in connection with the events specified in Section 16, which will be governed by that section), the portion of the Restricted Stock Units for which the restrictions have not lapsed as of the Termination of Service shall be forfeited immediately after the Company's notice or advice of such Termination of Service for Cause is dispatched to Grantee or on the date of Termination of Service for any other reason, except as otherwise specified in the Award Agreement. |
11. PERFORMANCE-BASED AWARDS
11.1. Nature of Performance-Based Awards. The purpose of this Section 11 is to provide the Committee the ability to qualify Awards as Qualified Performance-Based Compensation. If the Committee, in its discretion, decides to grant a Performance-Based Award to an Employee, the provisions of this Section 11 shall control over any contrary provision contained in Sections 7, 8, 9 and 10; provided, however, that the Committee may in its discretion grant Awards to Employees that are based on Performance Criteria or Performance Goals but that do not satisfy the requirements of this Section 11.
11.2. Applicability. This Section 11 shall apply only to those Employees selected by the Committee to receive Performance-Based Awards. The designation of an Employee as a Participant for a Performance Period shall not in any manner entitle the Participant to receive an Award. Moreover, designation of an Employee as a Participant for a particular Performance Period shall not require designation of such Employee as a Participant in any subsequent Performance Period and designation of one Employee as a Participant shall not require designation of any other Employees as a Participant in such period or in any other period.
11.3. Procedures With Respect to Performance-Based Awards. To the extent necessary to comply with the Qualified Performance-Based Compensation requirements of Section 162(m)(4)(C) of the Code, with respect to any Award that may be granted to one or more Employees, no later than ninety (90) calendar days following the commencement of any Year in question or any other designated fiscal period or period of service (or such other time as may be required or permitted by Section 162(m) of the Code), the Committee shall, in writing, (i) designate one or more Employees, (ii) select the Performance Criteria applicable to the Performance Period, (iii) establish the Performance Goals, and amounts of such Awards, as applicable, that may be earned for such Performance Period, and (iv) specify the relationship between the Performance Criteria and the Performance Goals and the amounts of such Awards, as applicable, to be earned by each Employee for such Performance Period. The Committee may provide in any such Award that any evaluation of performance may include or exclude any of the following events that occurs during a Performance Period: asset write-downs; litigation or claim judgments or settlements; the effect of changes in tax laws, accounting principles, or other laws or provisions affecting reported results; any reorganization and restructuring programs or other executive termination costs; extraordinary items (as defined in generally accepted accounting principles or any successor thereto); acquisitions or divestitures, including asset sales; the positive or negative impact of foreign exchange movements; stock-based compensation expense; in-process research and development expenses related to acquisitions; acquired intangible asset amortization; integration and other one-time expenditures or other adjustments related to acquisitions; material acquisition costs; merger costs, including severance, lease and other facility costs of the acquired company; gains or losses associated with either the repurchase or potential settlement of any or all of the Company's outstanding debt or convertible debt instruments; and/or the positive or negative impacts associated with the implementation of International Financial Reporting Standards. Following the completion of each Performance Period, the Committee, in its sole discretion, shall determine whether the applicable Performance Goals have been achieved for such Performance Period and shall certify such determination in writing. In determining the amount earned by an Employee, the Committee shall have the right to reduce or eliminate (but not to increase) the amount payable at a given level of performance to take into account additional factors that the Committee may deem relevant to the assessment of individual or corporate performance for the Performance Period.
11.4. Payment of Performance-Based Awards. Unless otherwise provided in the applicable Award Agreement, a Participant must be employed by the Company or a Subsidiary on the day a Performance-Based Award for such Performance Period is paid to the Participant. Furthermore, a Participant shall be eligible to receive payment pursuant to a Performance-Based Award for a Performance Period only if the Performance Goals for such period are achieved. In determining the amount earned under a Performance-Based Award, the Committee may reduce or eliminate the amount of the Performance-Based Award earned for the Performance Period, if in its sole discretion, such reduction or elimination is appropriate.
11.5. Additional Limitations. Notwithstanding any other provision of this Plan, any Award that is granted to an Employee and is intended to constitute Qualified Performance-Based Compensation shall be subject to any additional limitations set forth in Section 162(m) of the Code (including any amendment to Section 162(m) of the Code) or any regulations or rulings issued thereunder that are requirements for qualification as Qualified Performance-Based Compensation under Section 162(m)(4)(C) of the Code, and this Plan shall be deemed amended to the extent necessary to conform to such requirements.
12. SUBSTITUTE AWARDS AND COMBINED AWARDS.
12.1. Substitute Awards. If the Company or a Subsidiary at any time should succeed to the business of another corporation or other entity through merger or consolidation, or through the acquisition of stock (or other ownership interests) or assets of such other corporation or other entity, Awards may be granted under this Plan (“Substitute Awards”) in substitution of awards previously granted by such other corporation or other entity with respect to shares of its stock (or other ownership interests), which awards are outstanding at the date of the succession (“Surrendered Awards”). The Committee shall have discretion to determine the extent to which such Substitute Awards shall be granted, the persons to receive such Substitute Awards, the number of shares of Stock or their economic equivalent to be subject to such Substitute Awards, and the terms, conditions and restrictions of such Substitute Awards, which shall, to the extent permissible within the terms and conditions of this Plan, be equivalent to the terms, conditions and restrictions of the Surrendered Awards. The Exercise Price of any Substitute Award that is an Option or a SAR may be determined without regard to Sections 7.2 and 8.2; provided however, that the Exercise Price of each such Substitute Award shall be an amount such that, in the sole and absolute judgment of the Committee (and if the Substitute Award is to be an ISO, in compliance with Section 424(a) of the Code), the economic benefit provided by such Substitute Award is not greater than the economic benefit represented by the Surrendered Award as of the date of the succession.
12.2. Combined Awards. The Company may provide for payment to an Employee, Director, or Consultant of an amount earned under an Other Incentive Plan in the form of Stock or other Award under this Plan. In such case, the conditions and restrictions on the Award may be set under such Other Incentive Plan, which Award will be treated as a combined award under this Plan and the Other Incentive Plan, and the shares of Stock and Stock equivalents provided under Section 3 of this Plan shall be available to satisfy any payment of shares of Stock or Stock equivalents required or permitted under the Other Incentive Plan award.
13. NON-TRANSFERABILITY OF AWARDS.
All Awards under this Plan shall be nontransferable and shall not be assignable, alienable, saleable, or otherwise transferable by the Participant other than by will or the laws of descent and distribution or pursuant to a Domestic Relations Order.During the lifetime of a Participant, Options and SARs granted to him or her under this Plan shall be exercisable only by him or her except as otherwise determined by the Committee and specified in the Award Agreement. Notwithstanding the forgoing and excluding ISOs, the Committee may provide in an Award Agreement that a Participant may transfer, without consideration for the transfer, such Award to the Participant's immediate family members, to trusts for the benefit of the Participant and such immediate family members, to partnerships in which the Participant and such immediate family members are the only partners, or to charitable organizations, provided that transferee agrees in writing to be bound by all of the terms and conditions of this Plan and the applicable Award Agreement.
14. PAYMENT FOR SHARES OF STOCK.
14.1. General Rule. The entire consideration for shares of Stock issued under this Plan shall be payable in lawful money of the United States of America at the time when such shares of Stock are purchased, except as follows:
|
| | |
| (i) | Options. Payment of the Exercise Price of an Option shall be made pursuant to the express provisions of the applicable Award Agreement. However, the Committee (in its sole discretion) may specify in the Award Agreement that payment may (either with or without Committee approval) be made pursuant to Sections 14.2, 14.3 or 14.4, or any combination thereof. |
|
| | |
| (ii) | Restricted Stock Awards and RSU Awards. Payment (if any) for Restricted Stock and RSUs shall be made pursuant to the express provisions of the applicable Award Agreement, as determined by the Committee in its sole discretion. |
14.2. Surrender of Stock. To the extent that this Section 14.2 is applicable, payment may be made all or in part with shares of Stock that are owned by the Optionee or his or her representative and that are surrendered to the Company in good form for transfer. Such shares of Stock shall be valued at their Fair Market Value on the date when the new shares of Stock are purchased under this Plan.
14.3. Exercise/Sale (“Cashless Exercise”). To the extent that this Section 14.3 is applicable, payment may be made by the delivery of an irrevocable direction to a securities broker, acceptable to the Company, to sell shares of Stock and to deliver all or part of the sales proceeds to the Company in payment of all or part of the Exercise Price of the Option.
14.4. Net Share Exercise. To the extent that this Section 14.4 is applicable, payment may be made by holding back from the shares of Stock to be issued upon exercise of an Option that number of shares of Stock having a Fair Market Value equal to the minimum amount required to satisfy the Exercise Price (the Fair Market Value of the shares of Stock to be held back shall be determined on the date that the Option is exercised by the Optionee).
15. ADJUSTMENT OF STOCK.
15.1. General. In the event of: a subdivision of the outstanding Stock; a declaration of a dividend payable in shares of Stock; a declaration of a dividend payable in a form other than shares of Stock in an amount that has a material effect on the value of shares of Stock (a “Material Dividend”); a combination or consolidation of the outstanding Stock (by reclassification or otherwise) into a lesser number of shares of Stock; a recapitalization; a spinoff; a merger, consolidation, or other reorganization involving the Company that would not constitute a Change in Control; or any similar occurrence, then the Committee shall make appropriate adjustments (which adjustments shall be final, binding and conclusive on all parties) in one or more of:
|
| | |
| (i) | The maximum number of shares of Stock and Stock equivalents available under Section 3.1 for future grants of Awards and of specified types of Awards; |
|
| | |
| (ii) | The limitations set forth in Section 3.3; |
| (iii) | The number and kind of shares of Stock or Stock equivalents (or other securities) covered by each outstanding Award; |
|
| | |
| (iv) | The Exercise Price under each outstanding Option and SAR, but without changing the aggregate Exercise Price (i.e., the Exercise Price multiplied by the number of shares of Stock subject to the Option or SAR) as to which such Option or SAR remain exercisable; and |
|
| | |
| (v) | In the event of a Material Dividend, (A) the Exercise Price, including the aggregate Exercise Price (i.e., the Exercise Price multiplied by the number of shares of Stock subject to the Option or SAR), under each outstanding Option or SAR necessary to compensate for the loss of intrinsic value of such Award as a result of the Material Dividend and (B) other adjustments or actions appropriate to compensate for the loss of intrinsic value of such Award as a result of the Material Dividend; provided that any such adjustments or other actions described in subsections (A) or (B) shall be made in compliance with the Code (including Section 409A thereof) and the Treasury Regulations thereunder and any other applicable tax laws or regulations. |
15.2. Reservation of Rights. Except as provided in this Section 15, a Participant shall have no rights by reason of any subdivision or consolidation of shares of stock of any class, the payment of any dividend or any other increase or decrease in the number of shares of stock of any class. Any issue by the Company of shares of stock of any class, or securities convertible into shares of stock of any class, shall not affect, and no adjustment by reason thereof shall be made with respect to, the number or Exercise Price of shares of Stock subject to an Option or SAR and the number of or consideration for shares of Stock, subject to a Restricted Stock Award or RSU. The grant of an Option, SAR, Restricted Stock Award, or RSU pursuant to this Plan shall not affect in any way the right or power of the Company to make adjustments, reclassifications, reorganizations or changes of its capital or business structure, to merge or consolidate or to dissolve, liquidate, sell or transfer all or any part of its business or assets.
16. LIQUIDATION; CHANGE IN CONTROL AND OTHER TRANSACTIONS.
16.1. Dissolution or Liquidation. In the event of the proposed dissolution or liquidation of the Company, the Committee shall notify each Participant as soon as practicable prior to the effective date of such proposed transaction. The Committee in its discretion may provide for a Participant to have the right to exercise his or her Award until ten (10) days prior to such transaction as to all of the Stock covered thereby, including Stock as to which the Award would not otherwise be exercisable. In addition, the Committee may provide that any Company repurchase option or forfeiture rights applicable to any Award shall lapse as to all such Stock covered thereby, provided the proposed dissolution or liquidation takes place at the time and in the manner contemplated. To the extent it has not been previously exercised, an Award will terminate immediately prior to the consummation of such proposed action.
16.2. Change in Control and Other Corporate Transactions. In the event of a Change in Control, a merger or consolidation of the Company with or into another corporation, the sale of substantially all of the assets of the Company or other reorganization of the Company (each, a “Covered Transaction”), if the successor corporation, or a parent of the successor corporation, does not assume each outstanding Award or substitute the Award with an equivalent option or right (or if the Company is the surviving entity in the Covered Transaction, the Covered Transaction does not result in a continuation of the Award by the Company), any of the foregoing of which may be done on an Award-by-Award basis, then a Participant shall fully vest in and have the right to exercise the Award as to all of the Stock as to which it would not otherwise be vested or exercisable, and all restrictions and conditions outstanding on the Award shall be met. If an Award becomes fully vested and exercisable in lieu of assumption or substitution in the event of a Covered Transaction (or in lieu of continuation of the outstanding Award by the Company if the Company is the surviving entity in the Covered Transaction), then the Committee shall notify the Participant in writing or electronically that the Award shall be fully vested and exercisable for a period of fifteen (15) days from the date of such notice, and the Award shall terminate upon the expiration of such period. For purposes of this Section 16.2, the Award shall be considered assumed if, following the Covered Transaction, the option or right confers the right to purchase or receive, for each share of Stock subject to the Award immediately prior to the Covered Transaction, the consideration (whether stock, cash, or other securities or property) received in the Covered Transaction for each share of Stock held on the effective date of the Covered Transaction (and if holders were offered a choice of consideration, the type of consideration chosen by the holders of a majority of the outstanding Stock); provided, however, that if such consideration received in the Covered Transaction is not solely common stock of the successor corporation or its parent, then the Committee may, with the consent of the successor corporation or its parent, provide for the consideration to be received upon the exercise of the Award, for each share of Stock subject to the Award, to be solely common stock of the successor corporation or its parent equal in fair market value to the per share consideration received by holders of Stock in the Covered Transaction.
16.3. Involuntary Termination upon Change in Control. For purposes of clarification, the Committee shall have the full power and authority to provide in an Award Agreement that the Award shall become fully vested and exercisable in any Covered Transaction, including in the event of a Participant's Termination of Service without Cause or for Good Reason within a designated period (not to exceed eighteen (18) months) following the effective date of any Covered Transaction in which the Award does not otherwise accelerate. For purposes hereof, “Good Reason” shall mean a voluntary resignation by the Participant after any of the following effected without the Participant's consent: (A) a change in his or her position with the Company that materially reduces his or her duties and responsibilities or the level of management to which her or she reports, (B) a reduction in his her level of compensation (including base salary, fringe benefits and target bonus under any corporate performance based bonus or incentive programs) by more than fifteen percent (15%) or (C) a relocation of his or her place of employment by more than fifty (50) miles.
17. WITHHOLDING TAXES.
17.1. Payment by Participant; Deduction by Company. As a condition to the exercise of any Option, and no later than the date as of which the value of any other Award or of any Stock or other amounts received thereunder first becomes includable in the gross income of the Participant for Federal, state, or local income tax purposes, the Participant shall pay to the Company, or make arrangements satisfactory to the Committee regarding payment of, any Federal, state, or local taxes of any kind required by law to be withheld with respect to such income. The Company and its Subsidiaries shall have the right, to the extent permitted by law, to deduct any such taxes from any payment of any kind otherwise due to the Participant, including any payment or release of cash or shares of Stock under the applicable Award or any other Award.
17.2. Payment in Stock. With the permission of the Committee, or as specified in the Award Agreement, a Participant may elect to have such tax withholding obligation satisfied, in whole or in part, by (i) authorizing the Company to withhold from shares of Stock to be issued pursuant to any Award a number of shares with an aggregate Fair Market Value (as of the date the withholding is effected) that would satisfy the withholding amount due, or (ii) transferring to the Company shares of Stock owned by the Participant with an aggregate Fair Market Value (as of the date the withholding is effected) that would satisfy the withholding amount due.
18. SECURITIES LAWS.
Shares of Stock shall not be issued under this Plan unless the issuance and delivery of such shares of Stock complies with (or is exempt from) all requirements of Applicable Laws, including (without limitation) the Securities Act of 1933, as amended, the rules and regulations promulgated thereunder, state securities laws and regulations, and the regulations of any stock exchange on which the Company's securities may then be listed.
19. NO EMPLOYMENT RIGHTS.
Neither this Plan nor any Award shall give any person any right to be or remain an Employee, Director or Consultant of the Company or of any Subsidiary. The Company and its Subsidiaries reserve the right to terminate the service of any Employee, Director or Consultant at any time, with or without Cause, subject to applicable laws and written agreements (if any).
20. DURATION, AMENDMENTS, AND TERMINATION.
20.1. Term of this Plan. This Plan shall terminate automatically on the date which is ten (10) years after this Plan is approved by the Company's stockholders. No Award of any type may be granted under this Plan after such date. This Plan may be terminated on any earlier date pursuant to Section 20.2.
20.2. Right to Amend or Terminate this Plan. The Board may amend, suspend, or terminate this Plan at any time and for any reason. An amendment of this Plan shall be subject to the approval of the Company's stockholders only to the extent provided herein or required by Applicable Laws.
20.3. Effect of Plan Amendment or Termination. No amendment, suspension, or termination of this Plan (including at the end of the term specified in Section 20.1) shall impair the rights of any Participant with respect to any Award then outstanding, which shall continue in effect in accordance with the terms of the Award Agreement (as it may be amended from time to time) and of this Plan on the Grant Date until its expiration or earlier termination as specified in the Award Agreement. The termination of this Plan shall not affect the Committee's rights or obligations with respect to the continued exercise of its powers under this Plan regarding Awards that are outstanding at the time of termination.
21. MISCELLANEOUS.
21.1. Investment Representations. As a condition to the receipt of an Award or to the purchase or other receipt of shares of Stock pursuant to an Award, the Company may require the person receiving such Award or shares to represent and warrant that the Award or the shares of Stock being purchased or otherwise received are only for investment and without any present intention to sell or distribute such Award or shares of Stock if, in the opinion of counsel for the Company, such a representation is required.
21.2. Stockholder Approval. This Plan shall be subject to approval by the stockholders of the Company within twelve (12) months after the date this Plan is adopted by the Board, and no Awards shall be granted under this Plan until such stockholder approval is obtained. Such stockholder approval shall be obtained in the manner and to the degree required under Applicable Laws.
21.3. Nonexclusivity of this Plan. Neither the adoption of this Plan by the Board, the submission of this Plan to the stockholders of the Company for approval, nor any provision of this Plan will be construed as creating any limitations on the power of the Board to adopt such additional compensation arrangements as it may deem desirable, including, without limitation, the granting of stock options and bonuses otherwise than under this Plan, and such arrangements may be either generally applicable or applicable only in specific cases.
21.4. Successors. All obligations of the Company under this Plan, with respect to Awards granted hereunder, shall be binding on any successor to the Company, whether the existence of such successor is the result of a direct or indirect purchase, merger, consolidation, or otherwise, of all or substantially all of the business or assets of the Company.
21.5. Accounting Terms. Except as otherwise expressly provided or the context otherwise requires, financial and accounting terms are used as defined for purposes of, and shall be determined in accordance with, generally accepted accounting principles, as from time to time in effect, as applied and included in the consolidated financial statements of the Company prepared in the ordinary course of business.
21.6. Stock Certificates. Notwithstanding anything in this Plan to the contrary, to the extent this Plan provides for the issuance of stock certificates to reflect the ownership of shares of Stock or Restricted Stock, the issuance may be effected on a non-certificated basis, to the extent not prohibited by Applicable Laws.
21.7. Gender and Number. Except where otherwise indicated by the context, any masculine term used herein also shall include the feminine; the plural shall include the singular and the singular shall include the plural.
21.8. Severability. In the event any provision of this Plan shall be held illegal or invalid for any reason, the illegality or invalidity shall not affect the remaining parts of this Plan, and this Plan shall be construed and enforced as if the illegal or invalid provision had not been included.
21.9. Governing Law. This Plan, the Award Agreements, and all actions taken thereunder shall be governed by, and construed in accordance with, the laws of the State of Delaware, without regard to such state's or any other jurisdiction's conflicts of law principles.
2014 AMENDMENT
TO THE
STAMPS.COM INC. 2010 EQUITY INCENTIVE PLAN
Pursuant to Section 20.2 of the Stamps.com Inc. 2010 Equity Incentive Plan (the “Plan”), and the action of the Board of Directors of Stamps.com Inc. (the “Company”), the Company hereby adopts this Amendment to the Plan. This Amendment is effective September 9, 2014. Capitalized terms used in this Amendment, but not defined herein, shall have the respective meanings for such terms set forth in the Plan.
The Plan is amended in the following respects only:
| 1. | A new definition is added to Section 2 of the Plan to read as follows: |
1. A new definition is added to Section 2 of the Plan to read as follows:
“2014 Plan Amendment” means the amendment to this Plan adopted by action of the Board effective September 9, 2014, increasing the number of shares of Stock and Stock equivalents reserved and available for the grant of Awards under this Plan as set forth in Section 3.1. | 2. | The first sentence of Section 3.1 of the Plan is amended to read as follows: |
2. The first sentence of Section 3.1 of the Plan is amended to read as follows:
The maximum aggregate number of shares of Stock and Stock equivalents reserved and available for the grant of Awards under this Plan is the three million five hundred thousand (3,500,000) shares originally set forth in this Plan plus an additional two million one hundred thousand (2,100,000) shares added by the 2014 Plan Amendment, in each case calculated in accordance with Section 3.2. | 3. | Section 21.2A is added to the Plan to read as follows: |
3. Section 21.2A is added to the Plan to read as follows:
21.2A. Stockholder Approval of 2014 Plan Amendment. The 2014 Plan Amendment is subject to approval by the stockholders of the Company within twelve (12) months after the effective date of the 2014 Plan Amendment. No Awards of Restricted Stock or Restricted Stock Units may be granted (or any other issuances of shares of Stock made) with respect to the shares of Stock added to the Plan by the 2014 Plan Amendment unless and until such stockholder approval is obtained. Awards of Options and Stock Appreciation Rights may be granted with respect to the shares of Stock added to the Plan by the 2014 Plan Amendment prior to such stockholder approval, provided that any such Options and Stock Appreciation Rights may not be exercised or become exercisable unless and until such stockholder approval is obtained. Such stockholder approval shall be obtained in the manner and to the degree required under Applicable Laws. Executed on September 9, 2014, at El Segundo, California.
|
| | | |
| STAMPS.COM INC. | |
| | | |
| By: | /s/ Ken McBride | |
| Title: | Chief Executive Officer | |
2016 AMENDMENT
TO THE
STAMPS.COM INC. 2010 EQUITY INCENTIVE PLAN
Pursuant to Section 20.2 of the Stamps.com Inc. 2010 Equity Incentive Plan, as amended to date (the “Plan”), and the action of the Board of Directors of Stamps.com Inc. (the “Company”), the Company hereby adopts this Amendment to the Plan. This Amendment is effective April 28, 2016. Capitalized terms used in this Amendment, but not defined herein, shall have the respective meanings for such terms set forth in the Plan.
The Plan is amended in the following respects only:
1. A new definition is added to Section 2 of the Plan to read as follows:
“2016 Plan Amendment” means the amendment to this Plan adopted by action of the Board effective April 28, 2016, increasing the number of shares of Stock and Stock equivalents reserved and available for the grant of Awards under this Plan as set forth in Section 3.1.
2. The first sentence of Section 3.1 of the Plan is amended to read as follows:
The maximum aggregate number of shares of Stock and Stock equivalents reserved and available for the grant of Awards under this Plan is the three million five hundred thousand (3,500,000) shares originally set forth in this Plan plus the additional two million one hundred thousand (2,100,000) shares added by the 2014 Plan Amendment, plus an additional one million two hundred thousand (1,200,000) shares added by the 2016 Plan Amendment, in each case calculated in accordance with Section 3.2.
3. Section 21.2A is added to the Plan to read as follows:
21.2A. Stockholder Approval of 2016 Plan Amendment. The 2016 Plan Amendment is subject to approval by the stockholders of the Company within twelve (12) months after the effective date of the 2016 Plan Amendment. No Awards of Restricted Stock or Restricted Stock Units may be granted (or any other issuances of shares of Stock made) with respect to the shares of Stock added to the Plan by the 2016 Plan Amendment unless and until such stockholder approval is obtained. Awards of Options and Stock Appreciation Rights may be granted with respect to the shares of Stock added to the Plan by the 2016 Plan Amendment prior to such stockholder approval, provided that any such Options and Stock Appreciation Rights may not be exercised or become exercisable unless and until such stockholder approval is obtained. Such stockholder approval shall be obtained in the manner and to the degree required under Applicable Laws.
Executed on April 28, 2016, at El Segundo, California.
|
| | | |
| STAMPS.COM INC. | |
| | | |
| By: | /s/ Ken McBride | |
| Title: | Chief Executive Officer | |
ANNEX E
(2018 Amendment to the 2010 Equity Incentive Plan)
2018 AMENDMENT
TO THE
STAMPS.COM INC. 2010 EQUITY INCENTIVE PLAN
Pursuant to Section 20.2 of the Stamps.com Inc. 2010 Equity Incentive Plan, as amended to date (the “Plan”), and the action of the Board of Directors of Stamps.com Inc. (the “Company”), the Company hereby adopts this Amendment to the Plan. This Amendment is effective April 25, 2018. Capitalized terms used in this Amendment, but not defined herein, shall have the respective meanings for such terms set forth in the Plan.
The Plan is amended in the following respects only:
1. A new definition is added to Section 2 of the Plan to read as follows:
“2018 Plan Amendment” means the amendment to this Plan adopted by action of the Board effective April 25, 2018.
2. The first sentence of Section 3.1 of the Plan is amended to read as follows:
The maximum aggregate number of shares of Stock and Stock equivalents reserved and available for the grant of Awards under this Plan (the "Share Reserve") (which also is the maximum aggregate number of shares of Stock that may be issued pursuant to Incentive Stock Options granted under this Plan) is the three million five hundred thousand (3,500,000) shares originally set forth in this Plan plus the additional two million one hundred thousand (2,100,000) shares added by the 2014 Plan Amendment, plus an additional one million two hundred thousand (1,200,000) shares added by the 2016 Plan Amendment, plus an additional two million two hundred thousand (2,200,000) shares added by the 2018 Plan Amendment, in each case calculated in accordance with Section 3.2.
5. Section 6.2 of the Plan is amended in its entirety to read as follows:
6.2. Restriction on Repricing of Options and SARs. Subject to Section 15.1, no outstanding Option or SAR shall be amended to reduce its Exercise Price or cancelled or replaced with a new Award (of the same type or of any different type) having a lower exercise price (or other purchase price) for any reason, and no outstanding Option or SAR that has an Exercise Price greater than the current Fair Market Value of the Stock shall be cancelled or replaced in exchange for cash or any other property (except in connection with a Covered Transaction), in each case unless the Company’s stockholders entitled to vote at a meeting of stockholders have approved such action within twelve (12) months prior to such event.
4. The following provision is added as Section 6.4 of the Plan:
6.4 Minimum Vesting. All Awards other than Substitute Awards granted after the effective date of the 2018 Plan Amendment shall be granted subject to a minimum vesting period of at least twelve (12) months; provided, that up to five percent (5%) of the Share Reserve may be issued in respect of Awards that are not subject to the minimum vesting period requirement; provided, further that this Section 6.4 shall not apply to vesting of awards upon a Participant’s Termination of Service, death or Disability or following a Change in Control.
5. The following provision is added as Section 6.5 of the Plan:
6.5 No Dividend Payments on Unvested Awards. No dividends or dividend equivalents may be paid to a Participant with respect to an Award granted after the effective date of the 2018 Plan Amendment, unless and until the date the Participant vests in such Award or all restrictions lapse with respect to such Award. Notwithstanding the foregoing, if and to the extent provided in the applicable Award Agreement, dividends or dividend equivalents relating to Awards that are unvested or subject to restrictions may accrue and be paid to Participants at the time the underlying Award vests or its restrictions lapse and shall be forfeited to the extent the underlying Award is forfeited.
6. Section 9.6 of the Plan is amended in its entirety to read as follows:
9.6. Rights as Stockholder. Upon delivery of the Restricted Stock to the escrow holder or other action taken by the Committee pursuant to Section 9.3, the Grantee shall have all the rights of a stockholder of the Company with respect to the Restricted Stock, subject to the restrictions and the Award Agreement, including the right to vote the Restricted Stock and, subject to Section 6.5, the right to receive all dividends or other distributions paid or made with respect to the Restricted Stock; provided, however, that any additional shares of Restricted Stock to which Grantee shall be entitled as a result of stock dividends, stock splits, or any other form of recapitalization in respect of shares of Stock subject to restrictions shall also be subject to the restrictions until the restrictions on the underlying shares of Stock lapse, and any other form of dividends in respect of shares of Stock subject to restrictions shall also be subject to the restrictions and shall not be paid unless and until the restrictions on the underlying shares of Stock lapse.
7. Section 17.2 of the Plan is amended by the addition of the following sentence to the end thereof:
If shares of Stock that otherwise would be issued to the Participant are withheld by the Company to satisfy a tax withholding obligation, the shares applied to such tax withholding shall have a Fair Market Value that is no greater than the maximum statutory federal, state or local tax rates that could apply to the Award in the jurisdictions applicable to the Participant on the date that the amount of tax to be withheld is to be determined, or such other limitation as may be required by then applicable accounting rules and regulations to maintain favorable equity accounting treatment for the Award.
8. The first sentence of Section 20.1 of the Plan is amended to read as follows:
This Plan shall terminate automatically on April 25, 2028.
9. Section 21.2B is added to the Plan to read as follows:
21.2B. Stockholder Approval of 2018 Plan Amendment. The 2018 Plan Amendment is subject to approval by the stockholders of the Company within twelve (12) months after the effective date of the 2018 Plan Amendment. No Awards may be granted under the Plan after expiration of the original ten (10) year term of the Plan, unless and until such stockholder approval is obtained. No Awards of Restricted Stock or Restricted Stock Units may be granted (or any other issuances of shares of Stock made) with respect to the shares of Stock added to the Plan by the 2018 Plan Amendment unless and until such stockholder approval is obtained. Awards of Options and Stock Appreciation Rights may be granted with respect to the shares of Stock added to the Plan by the 2018 Plan Amendment prior to such stockholder approval, provided that any such Options and Stock Appreciation Rights may not be exercised or become exercisable unless and until such stockholder approval is obtained. Such stockholder approval shall be obtained in the manner and to the degree required under Applicable Laws.
Executed on April 25, 2018, at El Segundo, California.
|
| |
| STAMPS.COM INC. |
| | |
| By: __/s/ Ken McBride___________________ |
| | |
| Title: __Chief Executive Officer____________ |
PROXY
This Proxy is Solicited on Behalf of the Board of Directors of
STAMPS.COM INC.
Annual Meeting of Stockholders, June 11, 2018
The undersigned stockholder of Stamps.com Inc. hereby revokes all previous proxies, acknowledges receipt of the Notice of the Annual Meeting of Stockholders to be held June 11, 2018 and the Proxy Statement, each dated May 3, 2018, and hereby appoints each of Ken McBride and Matt Lipson, or either of them, as proxy and attorney-in-fact of the undersigned, with full power of substitution and revocation, on behalf and in the name of the undersigned, to represent the undersigned at the 2018 Annual Meeting of Stockholders and to vote all shares of common stock of STAMPS.COM INC. (the “Company”) that the undersigned is entitled to vote, either on his or her own behalf or on behalf of any entity or entities, at the 2018 Annual Meeting of Stockholders to be held at Stamps.com Inc., 1990 E. Grand Avenue, El Segundo, CA 90245 on June 11, 2018 at 10:00 a.m. Pacific Daylight Savings Time, and at any adjournment or postponement thereof, with the same force and effect as the undersigned might or could do if personally present thereat. The shares represented by this Proxy shall be voted in the manner set forth on this proxy card.
THIS PROXY CARD IS VALID ONLY WHEN SIGNED AND DATED.
|
| | | | | | |
| 1. | To elect one Class I director to serve for a three-year term ending at the Company’s 2021 annual meeting of stockholders or until his successor is duly elected and qualified; |
| G. Bradford Jones | FOR o | | WITHHOLD o | | |
| | | | | | |
| 2. | To approve, on a non-binding advisory basis, the Company’s executive compensation; |
| | | | FOR o | AGAINST o | ABSTAIN o |
| 3. | To approve the 2018 Amendment to the Stamps.com Inc. 2010 Equity Incentive Plan; |
| | | | FOR o | AGAINST o | ABSTAIN o |
| 4. | To ratify the appointment of Ernst & Young LLP as independent auditors of the Company for 2018. |
| | | | FOR o | AGAINST o | ABSTAIN o |
THIS PROXY, WHEN PROPERLY EXECUTED, WILL BE VOTED AS DIRECTED, OR IF NO CONTRARY DIRECTION IS INDICATED, WILL BE VOTED (I) FOR THE ELECTION OF THE DIRECTOR LISTED ABOVE, (II) FOR APPROVAL, ON A NON-BINDING ADVISORY BASIS, OF THE COMPANY'S EXECUTIVE COMPENSATION, (III) FOR THE 2018 AMENDMENT TO THE COMPANY'S 2010 EQUITY INCENTIVE PLAN, AND (IV) FOR THE RATIFICATION OF ERNST & YOUNG LLP AS INDEPENDENT AUDITORS OF THE COMPANY FOR 2018. THIS PROXY ALSO CONFERS DISCRETIONARY AUTHORITY ON THE PROXIES TO VOTE AS TO ANY OTHER MATTER THAT MAY PROPERLY BE BROUGHT BEFORE THE ANNUAL MEETING OF WHICH THE BOARD OF DIRECTORS DID NOT HAVE NOTICE PRIOR TO FEBRUARY 11, 2018.
MARK HERE FOR ADDRESS CHANGE AND NOTE AT RIGHT ¨
PLEASE CHECK HERE IF YOU PLAN TO ATTEND THE MEETING ¨
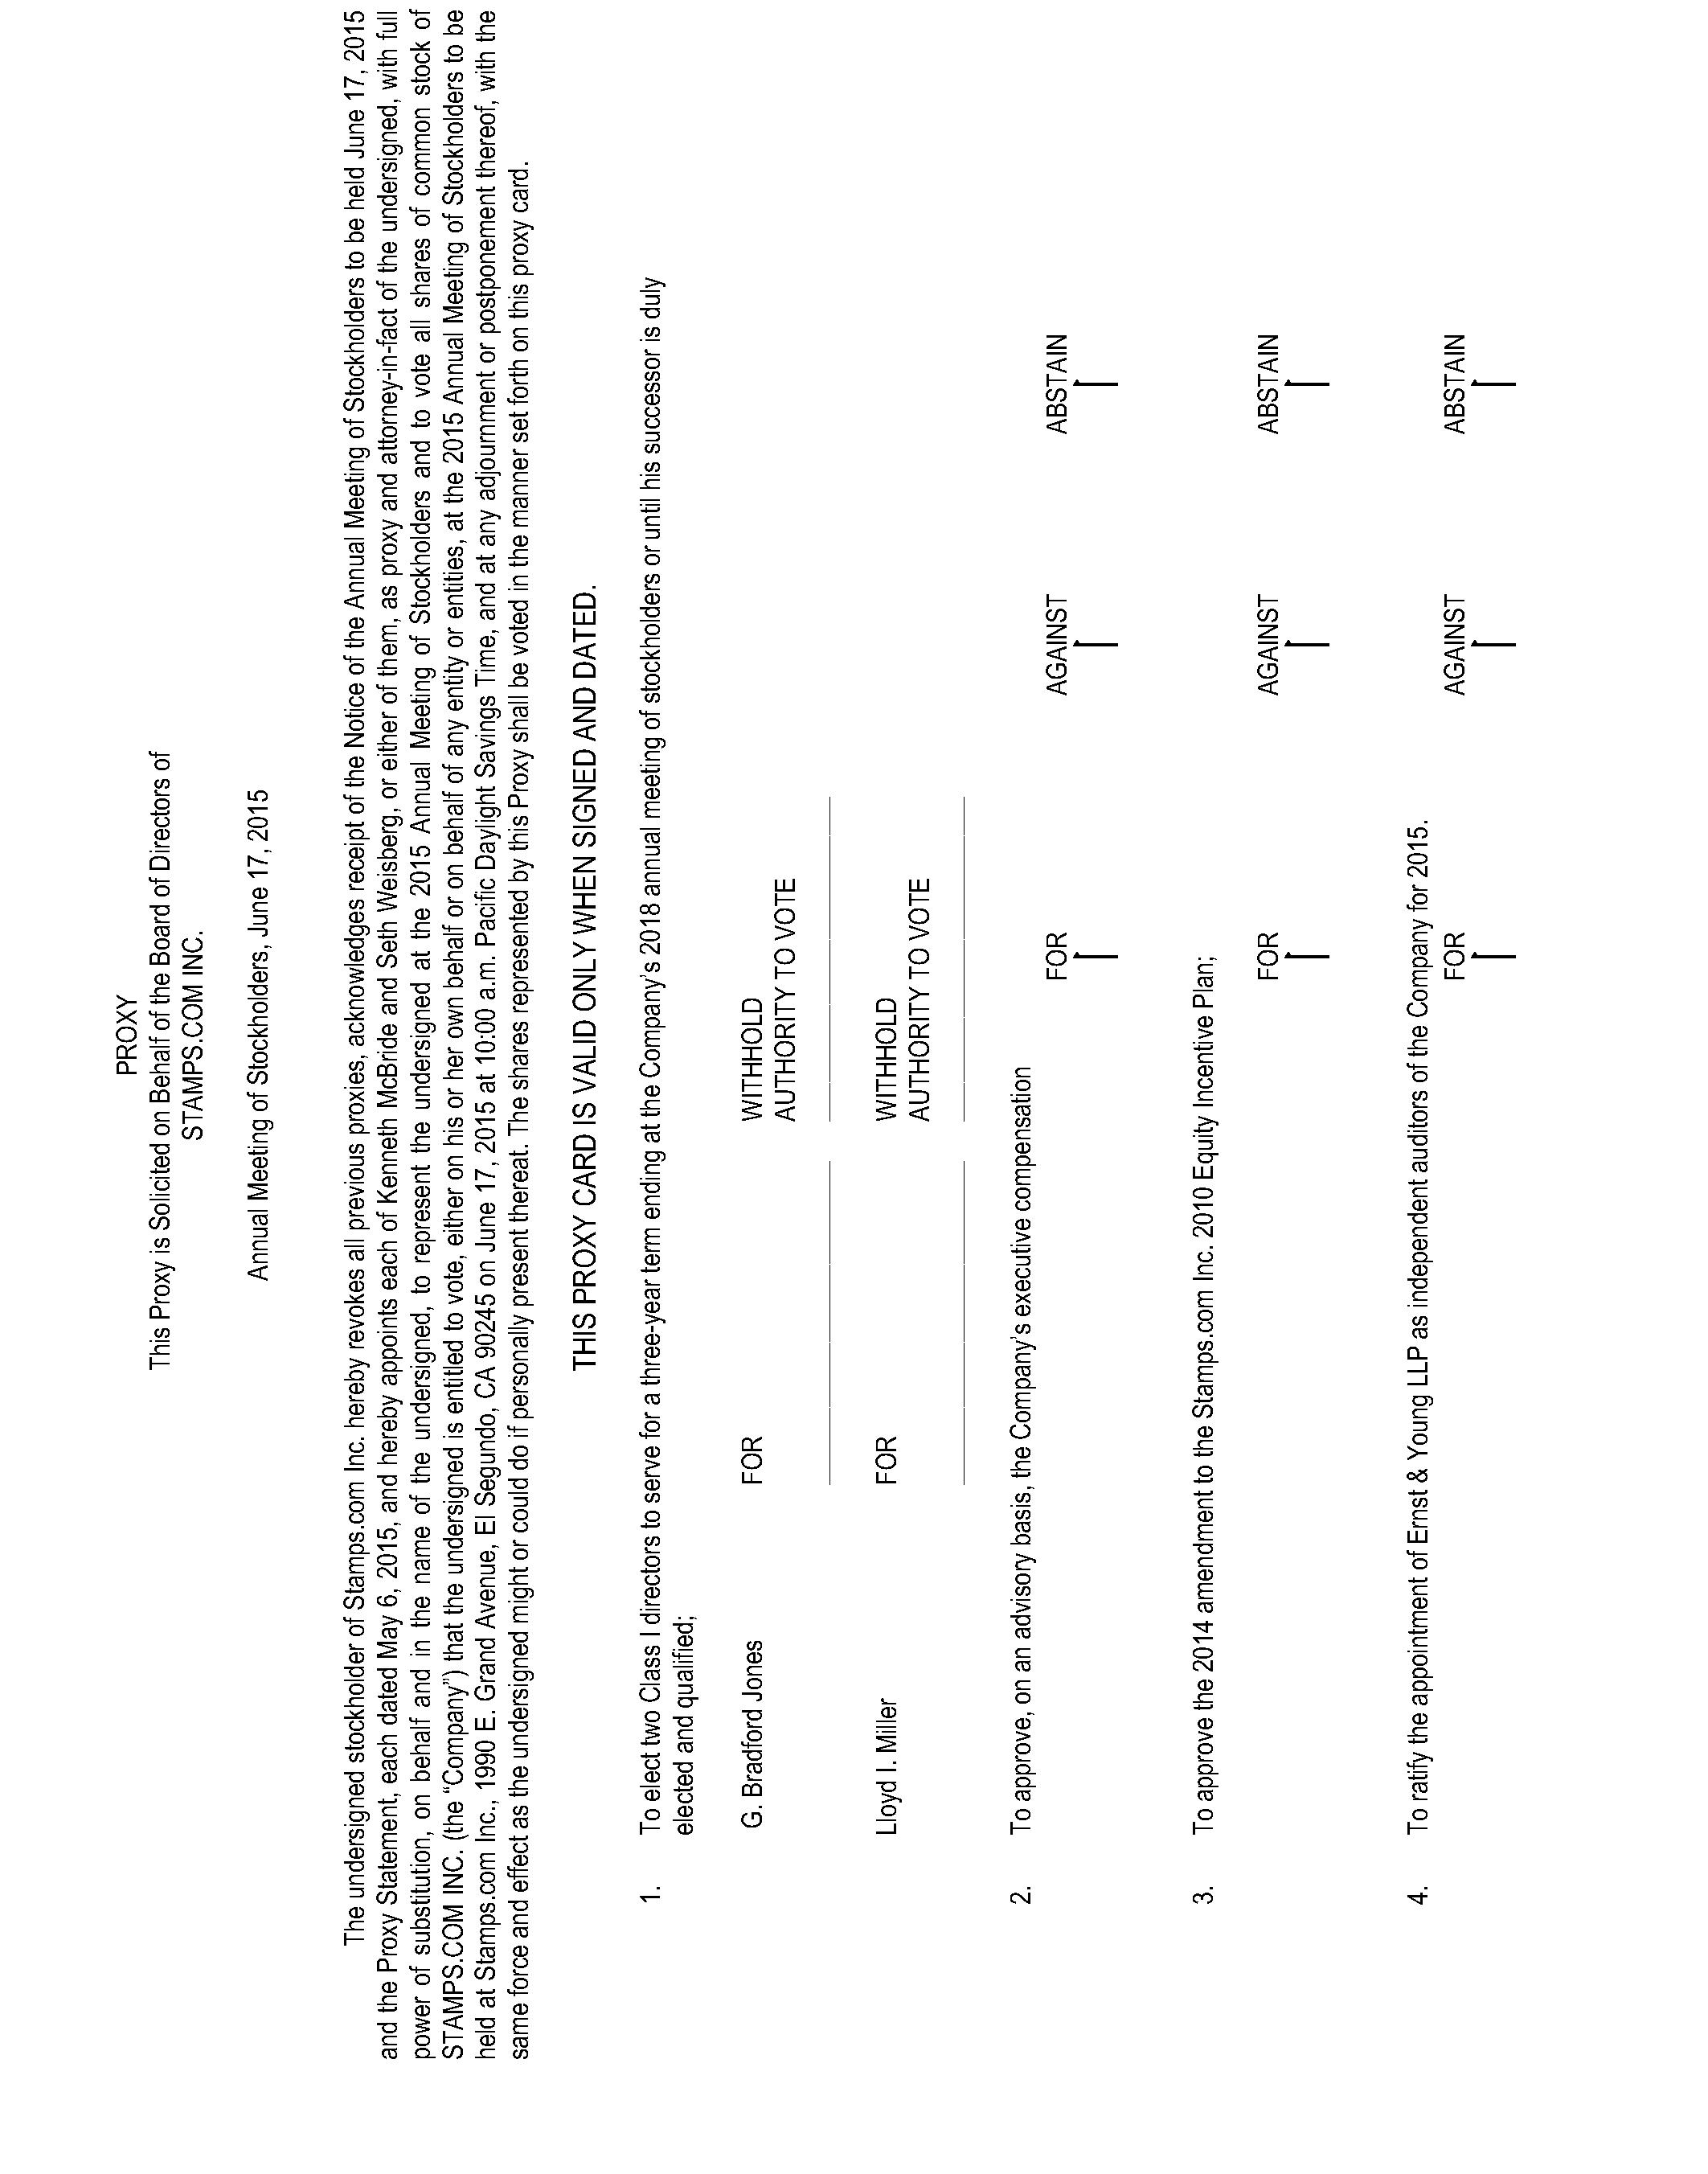
|
| | | | |
| Please print the name(s) appearing on each share certificate over which you have voting authority. Persons signing in a fiduciary capacity should so indicate. If shares are held by joint tenants or as community property, both must sign and date. | |
| (Print name(s) exactly as on certificate) |
| Please sign your name and date: | | Date: | |
| (Authorized Signature) | | |
| | Date: | |
| (Authorized Signature) | | |